What is a vintage curve?
A vintage is a cohort of loans originated in the same period, often a month or a quarter. A vintage curve plots a performance measure, such as cumulative net charge-offs or 30+ delinquency, against months on book: the number of months since origination.
Lining vintages up by months on book rather than by calendar date is what makes the comparison fair. A loan booked last quarter has had no time to go bad, so comparing it to a three-year-old loan on calendar date says little. Comparing month 9 to month 9 shows whether underwriting, channel or economic conditions changed how loans perform at the same age.
What is roll rate analysis?
A roll rate is the share of balances (or accounts) in one delinquency stage that move to a worse stage in the next period. For example, the 30-to-60+ roll rate is the share of balances 30 to 59 days past due this month that are 60 or more days past due, or charged off, next month.
Roll rates are an early signal. Charge-offs arrive months after a borrower first misses a payment, but a rising roll rate from 30 into 60+ often shows up well before losses do. Many teams track a full migration matrix, from current through each bucket to charge-off.
Why roll rates mislead without denominators
A roll rate is a ratio, and ratios hide their size. A jump from 20% to 35% could mean 7 more accounts rolled out of a bucket of 40, or thousands. Seasonal drops in the 30-day bucket can also push the rate up even when the number of accounts rolling forward is flat.
The same applies to vintage curves. Late in a vintage's life the remaining balance gets small, and a single charge-off can make the curve bend sharply. Without the denominator next to the rate, it is easy to chase noise.
- Show the starting balance and account count for each roll
- Show the remaining exposure at each month on book
- Keep missing months visible instead of interpolating over them
How Aarvion builds vintage curves and migration
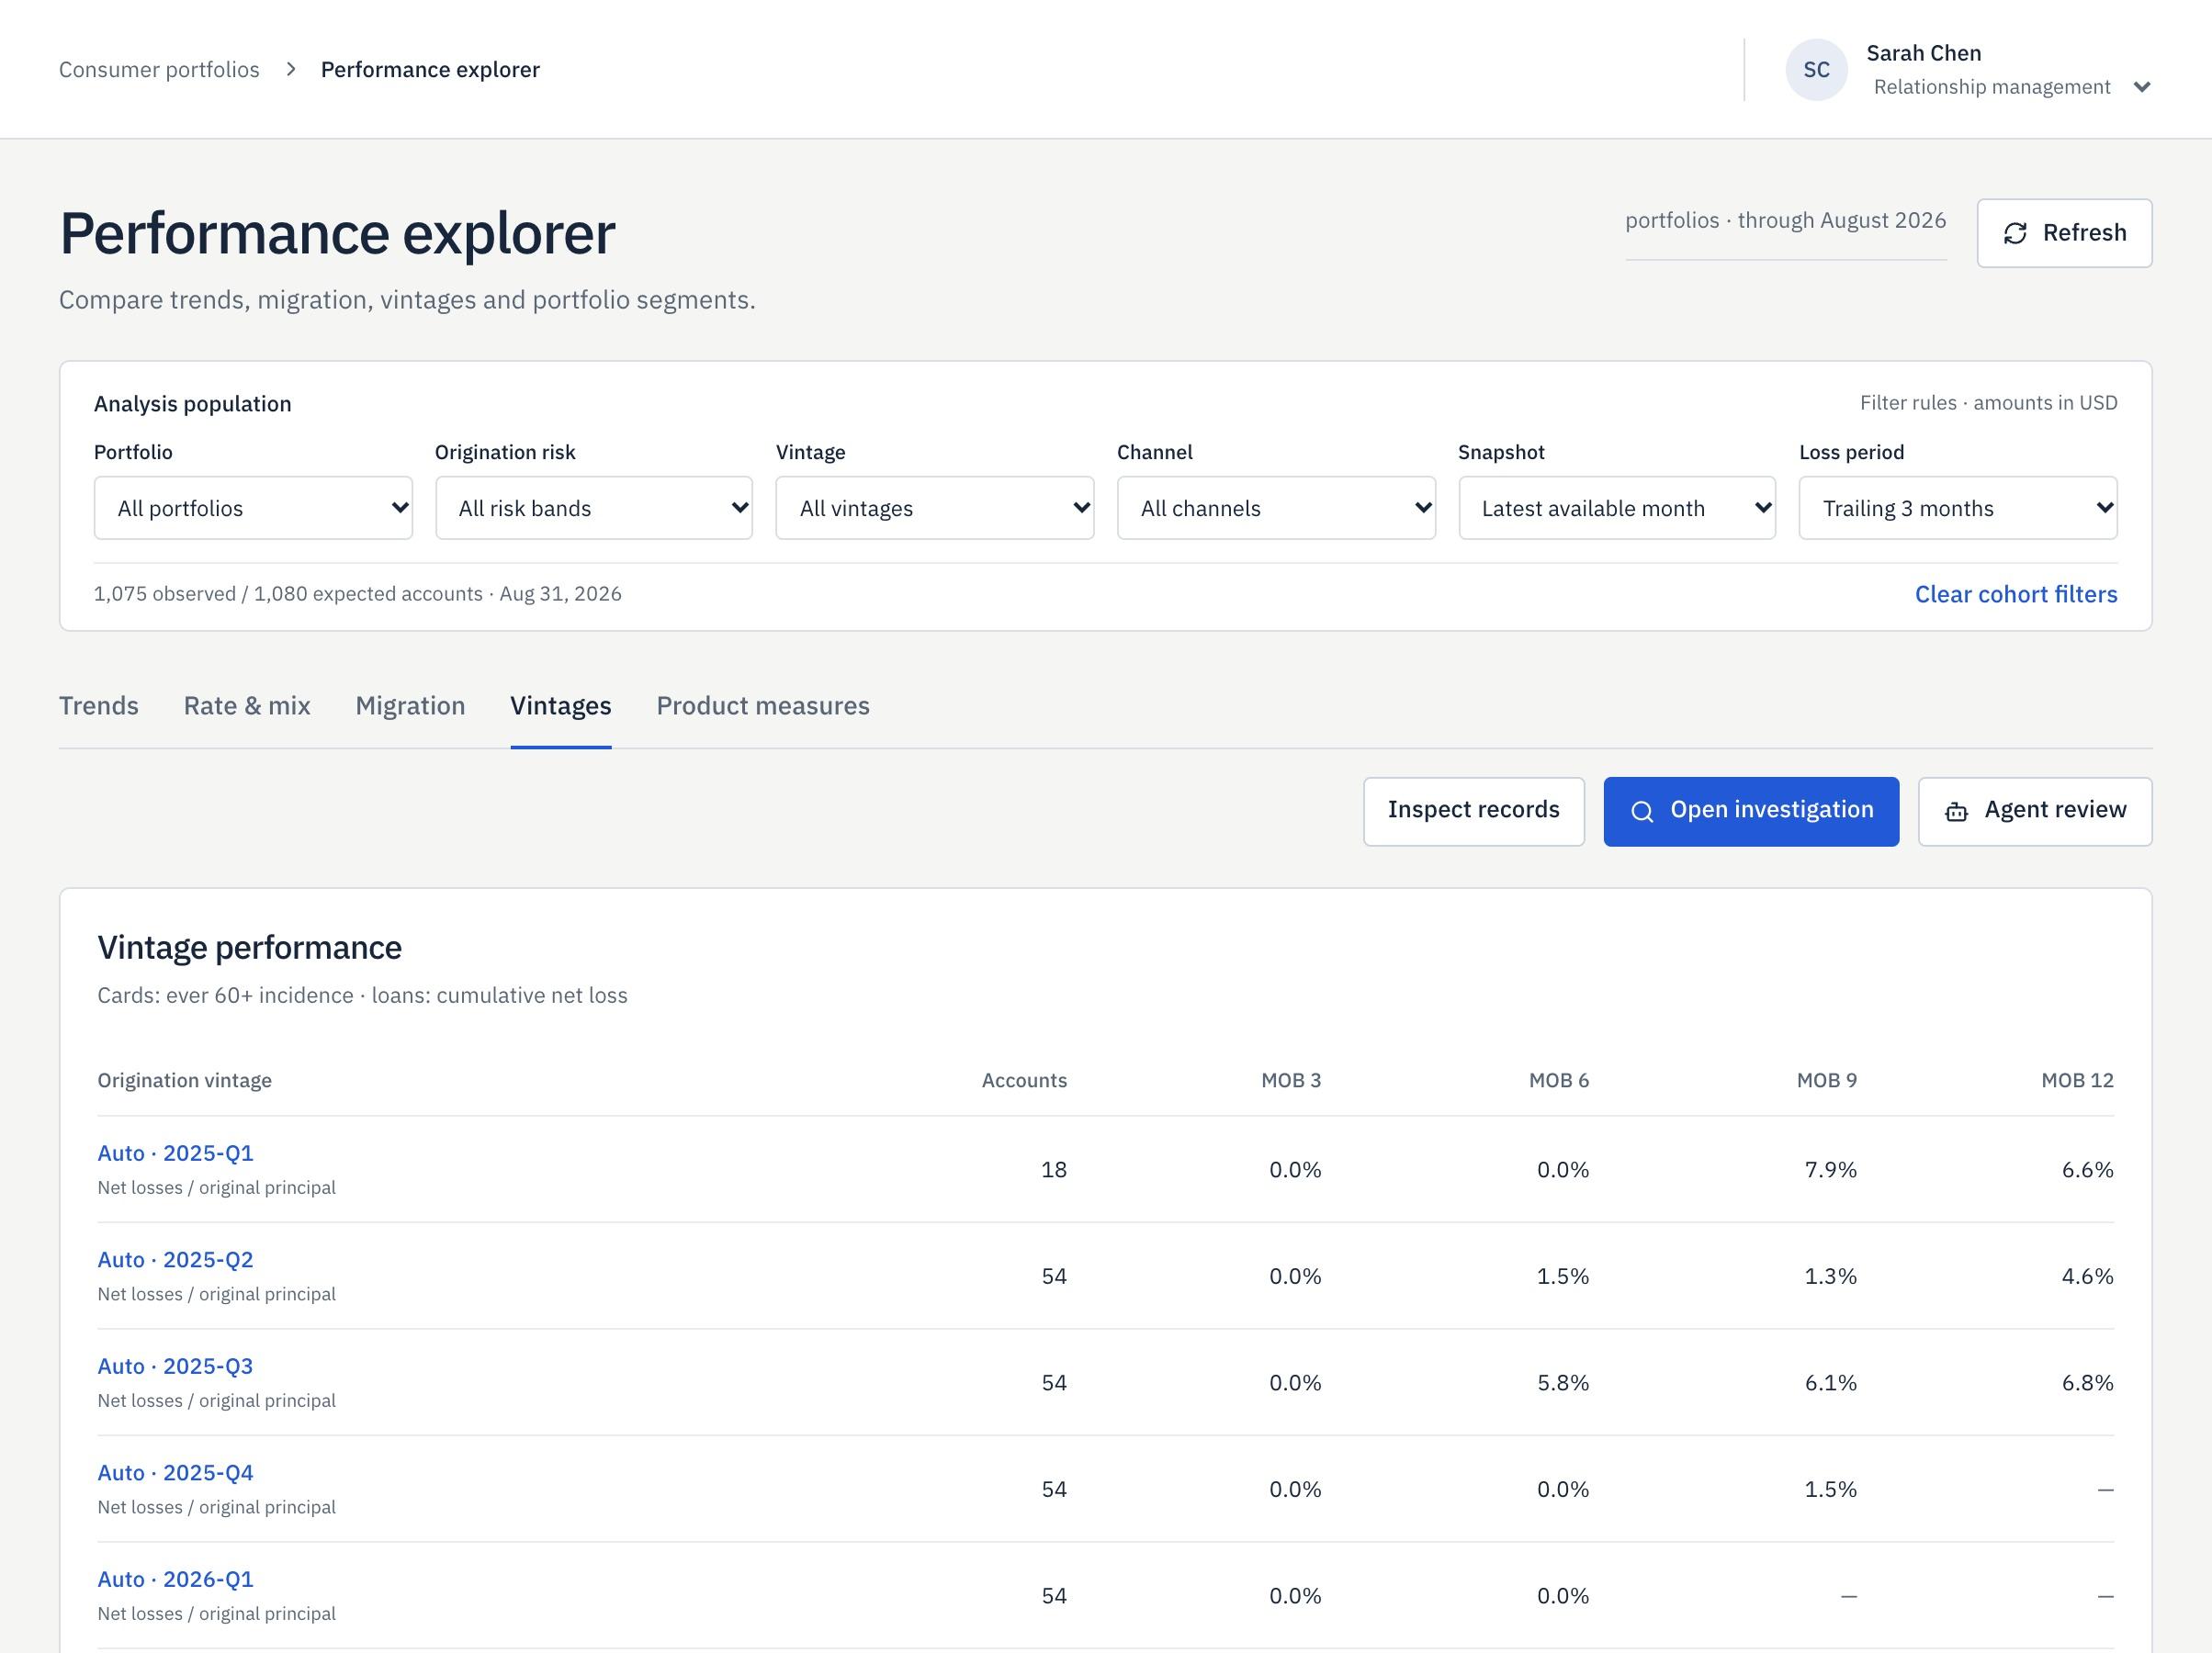
The Aarvion performance explorer covers trends, rate and mix, migration and roll rates, vintage curves and product-specific measures for credit cards, auto loans and personal loans. Migration includes 30-to-60+ movement with charge-off counted as a worse state, and vintages are compared at equal months on book.
Every numerator and denominator is visible. Missing observations and stale valuations are shown rather than hidden. For auto loans, loan-to-value appears with its valuation coverage, so you can see how much of the vintage the figure covers. Account-level records and CSV downloads sit behind each number for anyone who wants to check the math.
From a weak vintage to a case and a monitoring plan
When a vintage or a roll rate looks wrong, you can save the cohort as an investigation with an owner, due date, notes and its latest evidence. Preparation produces a brief with measured facts, hypotheses, data gaps and proposed work.
If the review agrees the cohort needs watching, it can approve a monitoring plan on 30+ delinquency, 30-to-60+ migration or annualized net charge-offs, with a threshold, owner, review date and response. Each run records value, denominator, exposure, coverage, threshold and source revision, and anything unmeasurable is marked Not tested.
What analysts still decide
Aarvion does the cohort building and the bookkeeping. Your analysts still choose the cohorts that matter, judge whether a difference is real or a small-sample artifact, and decide what the business should do about it. Every AI step is checked against your own credit rules and recorded with who proposed it, which rule applied, who approved it and when. A 90-day pilot on one workflow is the usual starting point.
Retail Credit
Consumer loan portfolio monitoring you can trace to the account
Retail Credit
Collections strategy software that compares treatments fairly
Guide · 6 min read
Vintage Analysis Explained: How to Build and Read Vintage Curves
Guide · 6 min read
Roll Rate Analysis: How to Calculate and Read Delinquency Roll Rates