What is consumer loan portfolio monitoring?
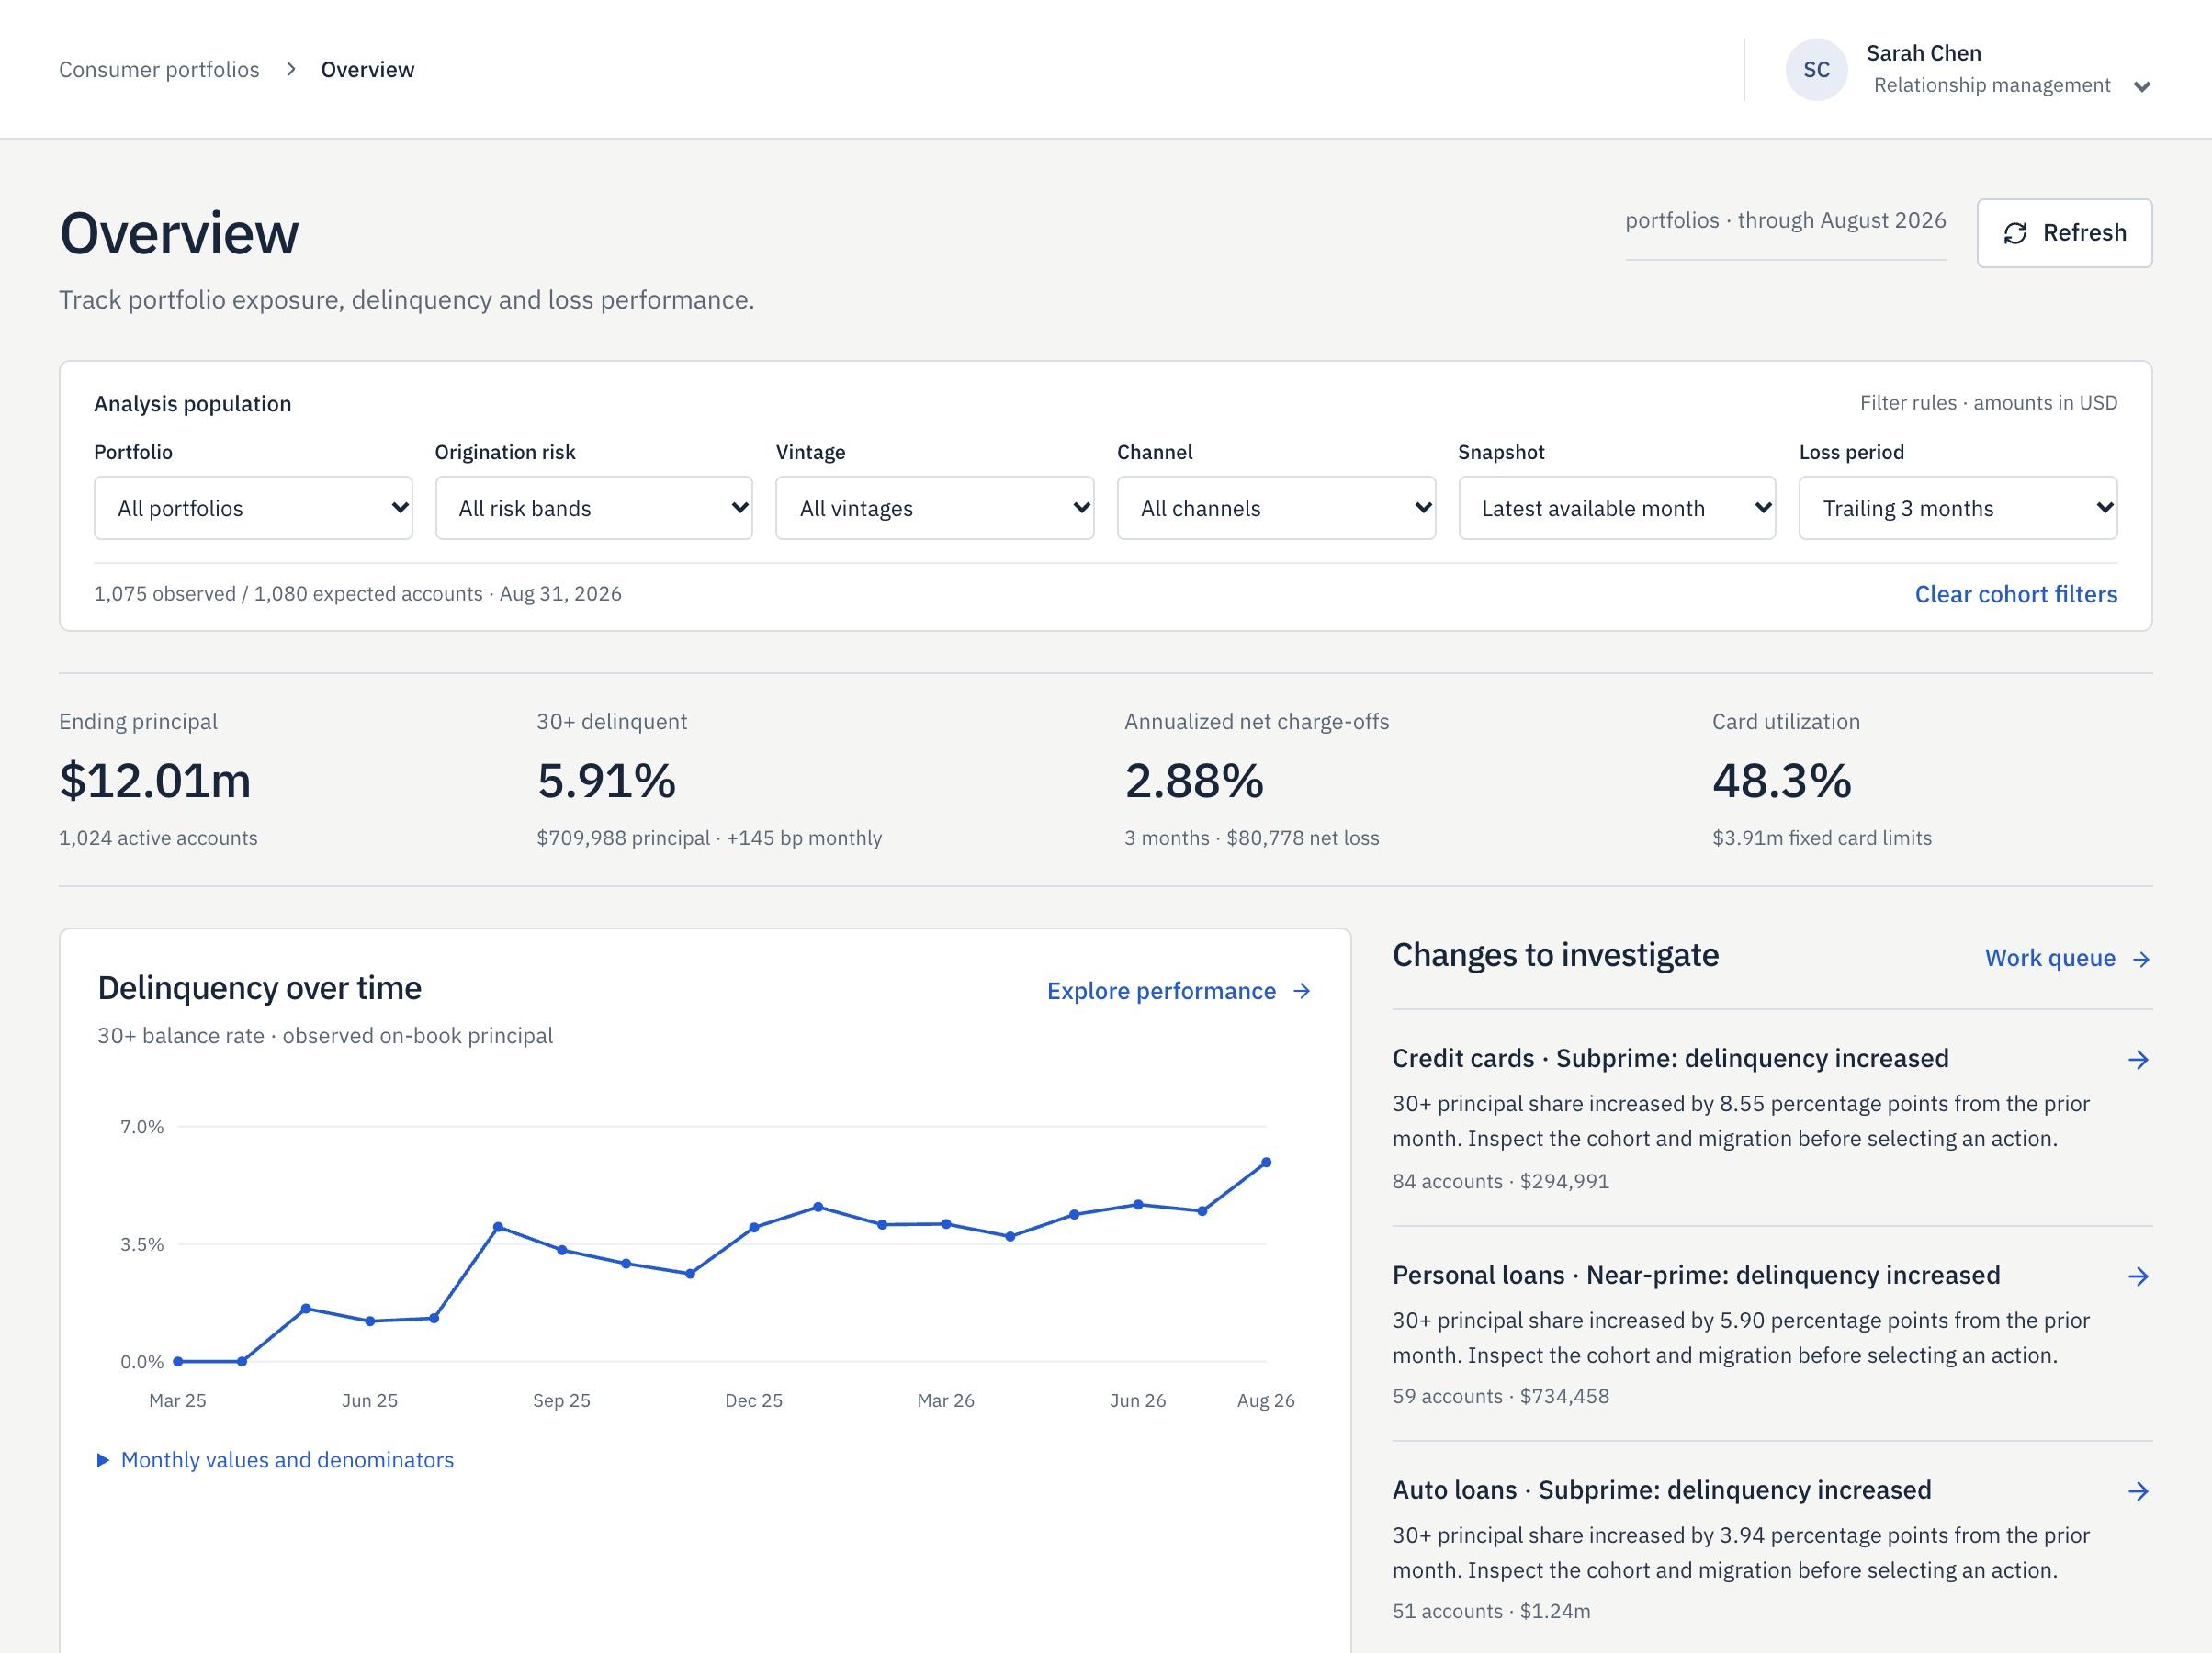
Portfolio monitoring means tracking a handful of measures over time for a pool of consumer loans, then cutting them by the segments that explain movement. The usual core set is outstanding balance or exposure, the share of balances 30 or more days past due, net charge-offs as an annualized rate, and for cards, utilization of available lines.
The point is not the dashboard. The point is noticing when one segment starts behaving differently from the rest, understanding why, and deciding whether it needs a closer look, a formal monitoring plan, or nothing at all.
- Exposure: ending principal outstanding
- 30+ delinquency: share of exposure 30 or more days past due
- Annualized net charge-offs: losses net of recoveries, scaled to a yearly rate
- Card utilization: balances as a share of committed lines
Which segments matter for delinquency monitoring?
Portfolio averages hide problems. A stable 30+ delinquency rate can mask a rising rate in one origination risk band offset by an improving one elsewhere. Useful cuts for a consumer book are product, origination risk band, vintage (the period loans were booked), acquisition channel and the period in which losses were reported.
Aarvion Retail Credit shows exposure, 30+ delinquency, annualized net charge-offs and card utilization across each of those cuts for credit cards, auto loans and personal loans. When a segment moves in a way worth investigating, it is flagged along with the number of accounts and the principal behind it, so you can judge size before you spend time on it.
Why every rate needs its numerator and denominator
A delinquency rate of 4% on 50 accounts and 4% on 50,000 accounts are very different signals. A rate that jumps because the denominator shrank, for example as an older vintage pays down, tells a different story than one that jumps because new delinquencies appeared.
In Aarvion, every numerator and denominator is visible next to the rate. Missing observations and stale valuations stay visible instead of being quietly dropped, so a gap in the data does not look like an improvement in the portfolio. For auto loans, loan-to-value is shown with its valuation coverage, so you know how much of the book the figure actually describes.
From a flagged change to an investigation
Once something looks off, the work shifts from watching to explaining. In Aarvion you can save the cohort behind a flagged change as a case with an owner, a due date, notes and its latest evidence.
Preparation produces a brief that separates measured facts from hypotheses, lists data gaps, and proposes the next pieces of work. A reviewer can then approve a monitoring plan, return the case for more work, or close it.
Turning a concern into a monitoring plan
A monitoring plan pins down what you will watch and what happens if it moves. In Aarvion that means a chosen metric (30+ delinquency, 30-to-60+ migration, or annualized net charge-offs), a threshold, an owner, a review date and an agreed response. Approval requires current evidence and complete coverage.
Each run records the value, denominator, exposure, coverage, threshold and source revision. If an observation cannot be measured, it is marked Not tested rather than passed. Approving a plan authorizes monitoring only. It does not change any customer account.
What your team still decides
Aarvion measures, flags and records. Your team decides which changes matter, which thresholds fit your risk appetite, and what the response should be. Every AI step is checked against your own credit rules, which can allow it, hold it for the right signer, block it, or stop everything, and each step records who proposed it, which rule applied, who approved it and when.
Aarvion works alongside your existing core and reporting systems, with source coverage, definitions, account-level records and CSV downloads behind every number. Most teams start with a 90-day pilot on one workflow.
Retail Credit
Vintage analysis and roll rates with the denominators showing
Retail Credit
Collections strategy software that compares treatments fairly
Guide · 6 min read
Roll Rate Analysis: How to Calculate and Read Delinquency Roll Rates
Guide · 6 min read
Vintage Analysis Explained: How to Build and Read Vintage Curves